Debugging and Logging the Viewer
In some cases errors which happen on your machine do not happen in the development environment. In this cases it might be helpful if you capture a log of what is happening.
Logging
The viewer comes with extended logging functionality, but usually this functionality is switched off as it is using up some resources. To enable logging it is necessary to start the viewer from the command line.
Under Windows the easiest way to do this is to use the Windows Explorer to
move to the directory folder which contains the caffviewer.jar file you
downloaded from this web site. Right click on the folder (not the jar file)
while pressing the Shift button. This opens an extended context menu, where
you can select Open Command Window here or Open Power Shell here.
In the window which appears then copy the following command line
java -Ddebug=true -jar caffviewer.jar
and hit the enter key.
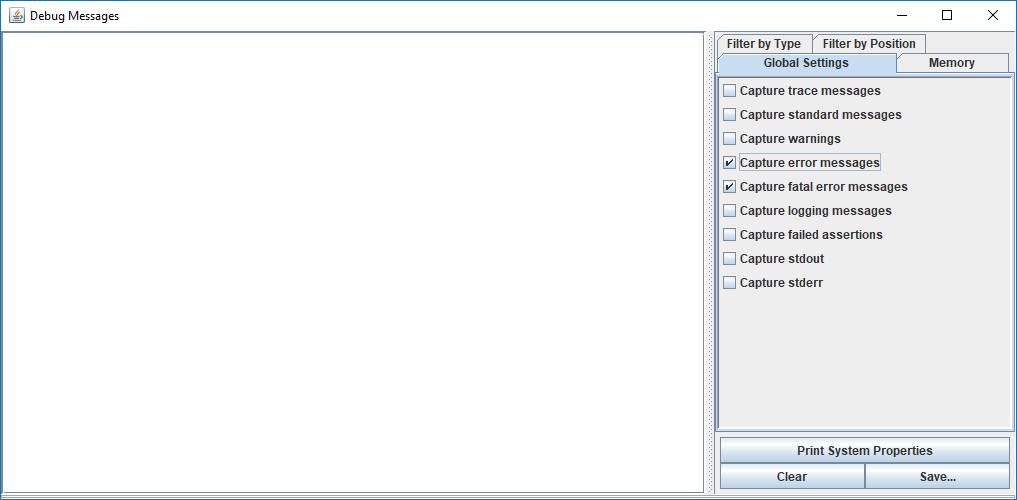
This will start the viewer with an additional Debug menu. Select Show Debug Window from this menu. This opens another window titled Debug Messages. Initially all checkboxes in the Global Settings tab are unticked, meaning that no debug messages will be captured. At least check Capture error messages and Capture fatal error messages. Depending on the problem also checking Capture warnings and even Capture messages might be necessary, but the more boxes you check the more messages will be captured.
Now let the viewer run into the error. After that hopefully some messages have
appeared in the debug window. If possible click the Print System
Properties button once. This will add helpful information about your
computer and Java environment (but please note that the properties will
contain some private information like your user name and home
directory). Press the Save… button to safe the content of the debug
window into a text file, eg debug.txt (from that you can remove private
information using a text editor). Send this file to
rammi@caff.de.
Thanks for helping to make the viewer a better tool!